
Visualization
SpeedyWeather.jl provides flexible visualization tools through its RingGrids module, which includes Makie and GeoMakie extensions for both 2D heatmap plots and interactive 3D globe visualizations.
Heatmap Plots
The heatmap function provides a convenient way to visualize 2D fields on the sphere.
For full fields (which can be reshaped into matrices), creating a heatmap is straightforward:
using SpeedyWeather
using CairoMakie, GeoMakie
import Random
Random.seed!(1234)

grid = FullGaussianGrid(24)
field = randn(grid)
heatmap(field)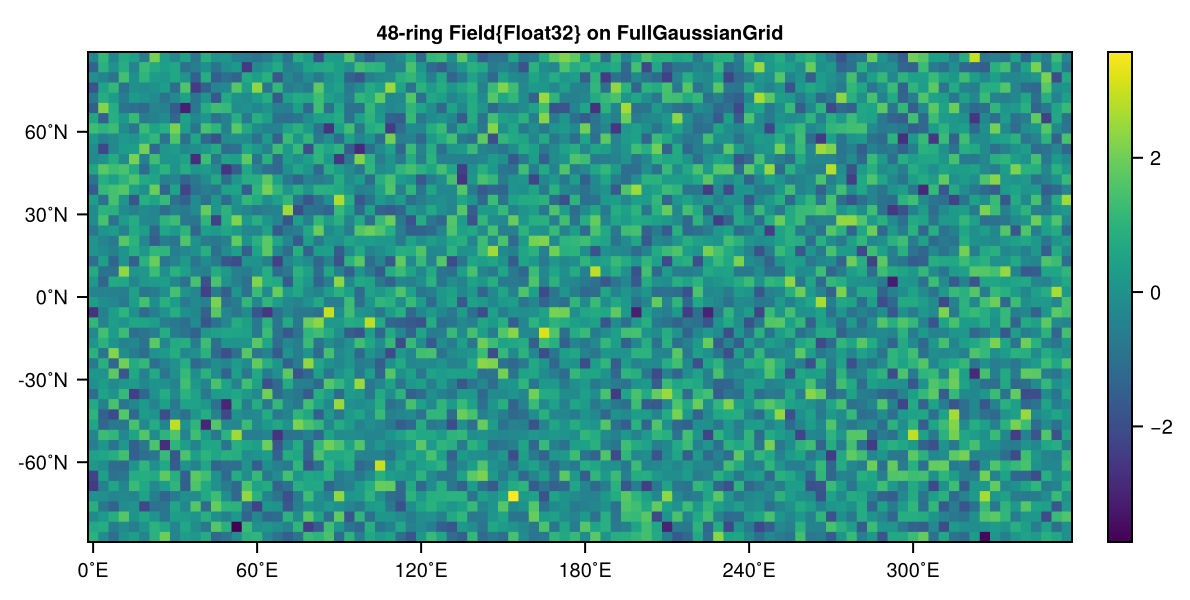
The heatmap automatically:
Sets the correct aspect ratio (2:1 for global maps)
Labels longitude ticks in degrees East (0˚E, 60˚E, 120˚E, ...)
Labels latitude ticks in degrees North (-60˚N, -30˚N, 0˚N, ...)
Adds a colorbar
Generates a descriptive title
For reduced grids (like OctahedralGaussianGrid or HEALPixGrid), the field is automatically interpolated to a full grid before plotting:
grid = OctahedralGaussianGrid(24)
field = randn(grid)
heatmap(field)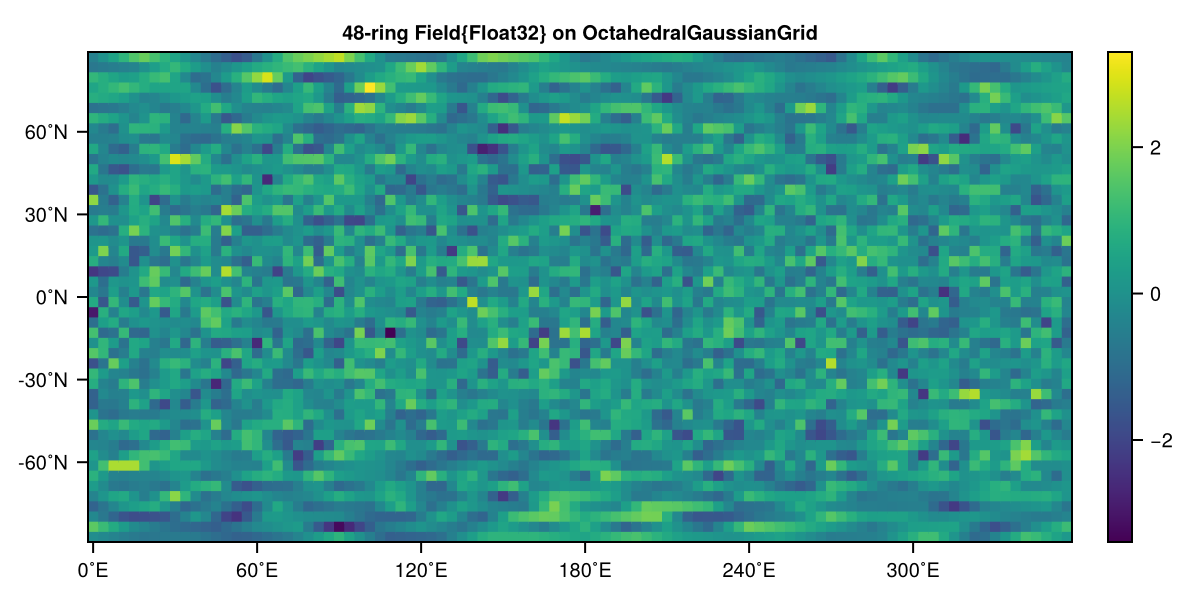
You can also pass additional keyword arguments to customize the appearance:
grid = FullGaussianGrid(24)
field = randn(grid)
heatmap(field; colormap = :thermal, colorrange = (-2, 2), title = "Temperature Anomaly")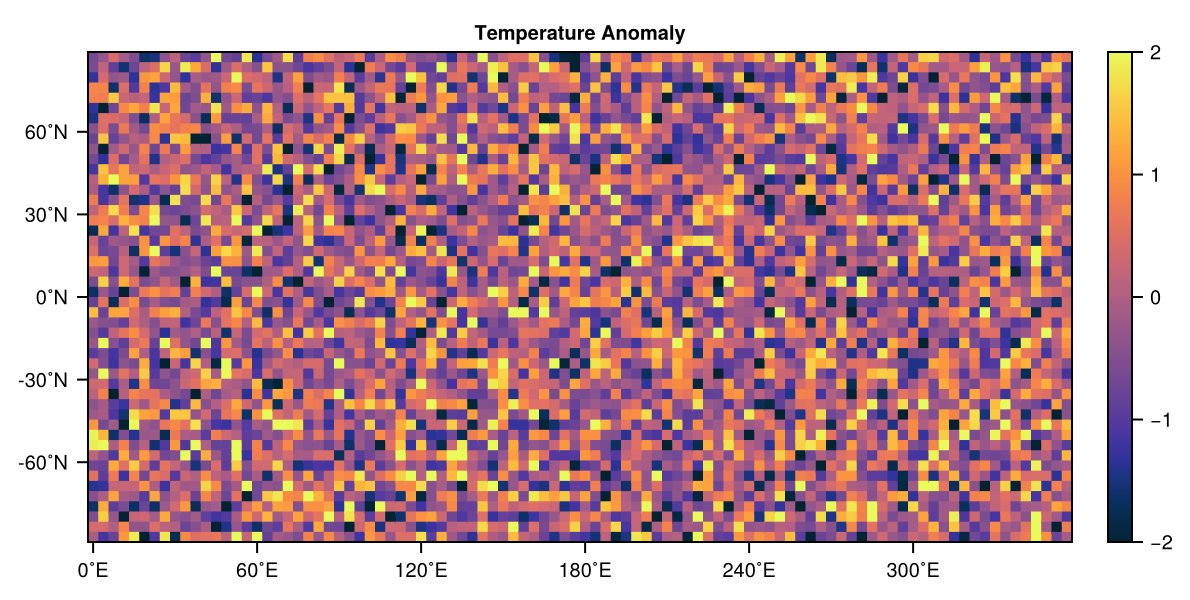
Mutating variants of heatmap are also provided which can be used to plot into an externally defined Figure or Axis:
grid = FullGaussianGrid(24)
fig = Figure(size = (600, 600))
field1 = randn(grid)
ax1, hm1 = heatmap!(fig[1, 1], field1; title = "Time step 1")
field2 = randn(grid)
ax2, hm2 = heatmap!(fig[2, 1], field2; title = "Time step 2")
fig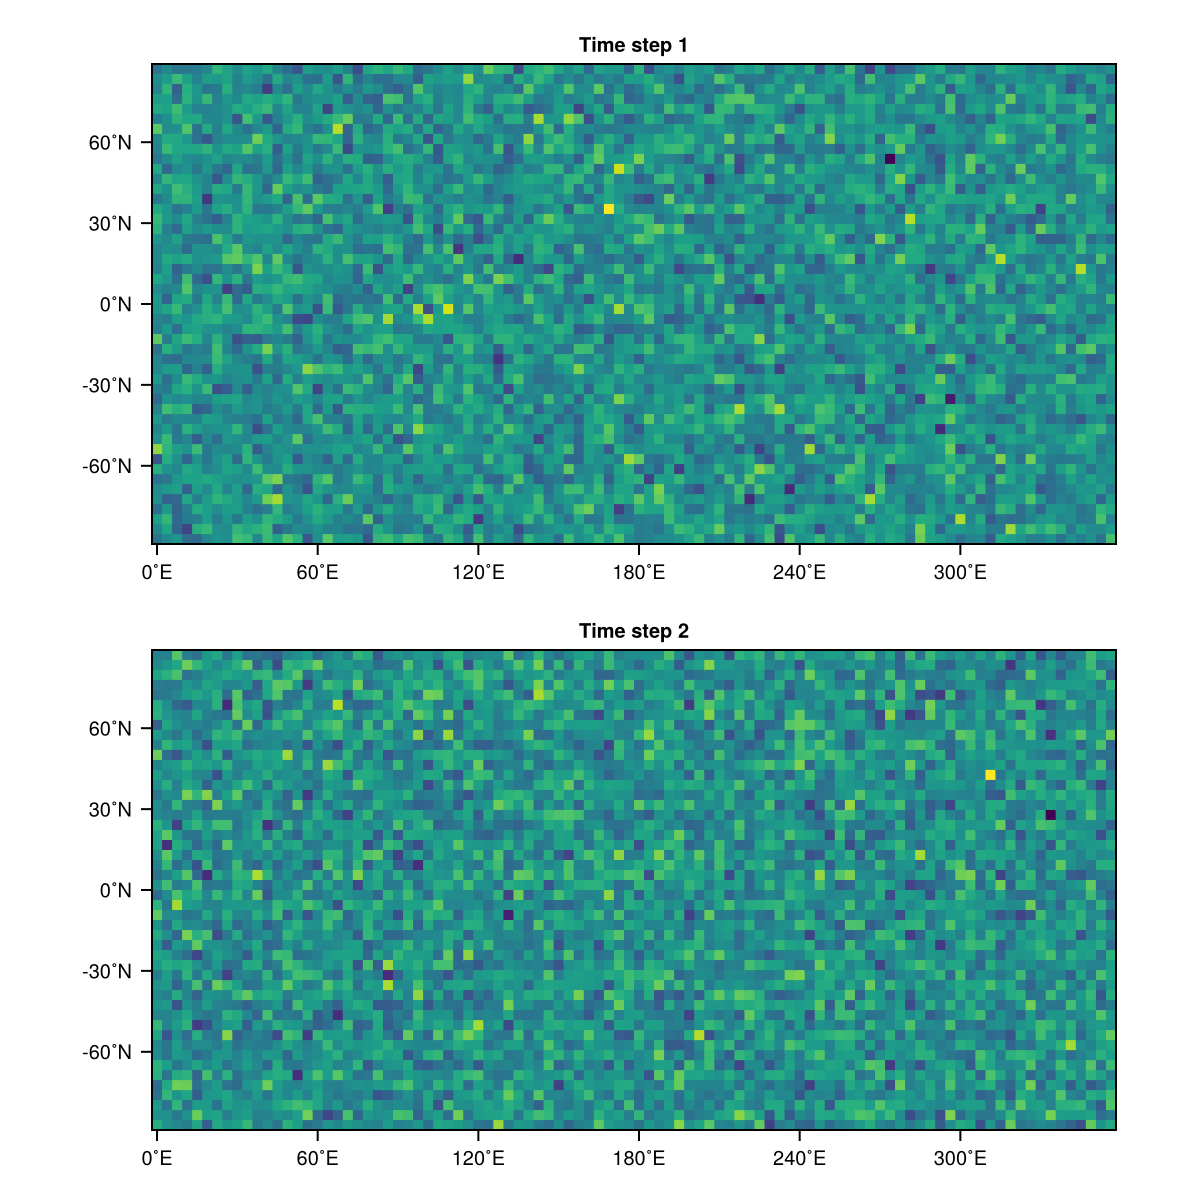
Passing an existing Axis instead plots into that axis, e.g. to update a panel. Axis attributes like the title are then set on the axis directly:
field3 = randn(grid)
ax2.title = "Time step 3"
heatmap!(ax2, field3)
fig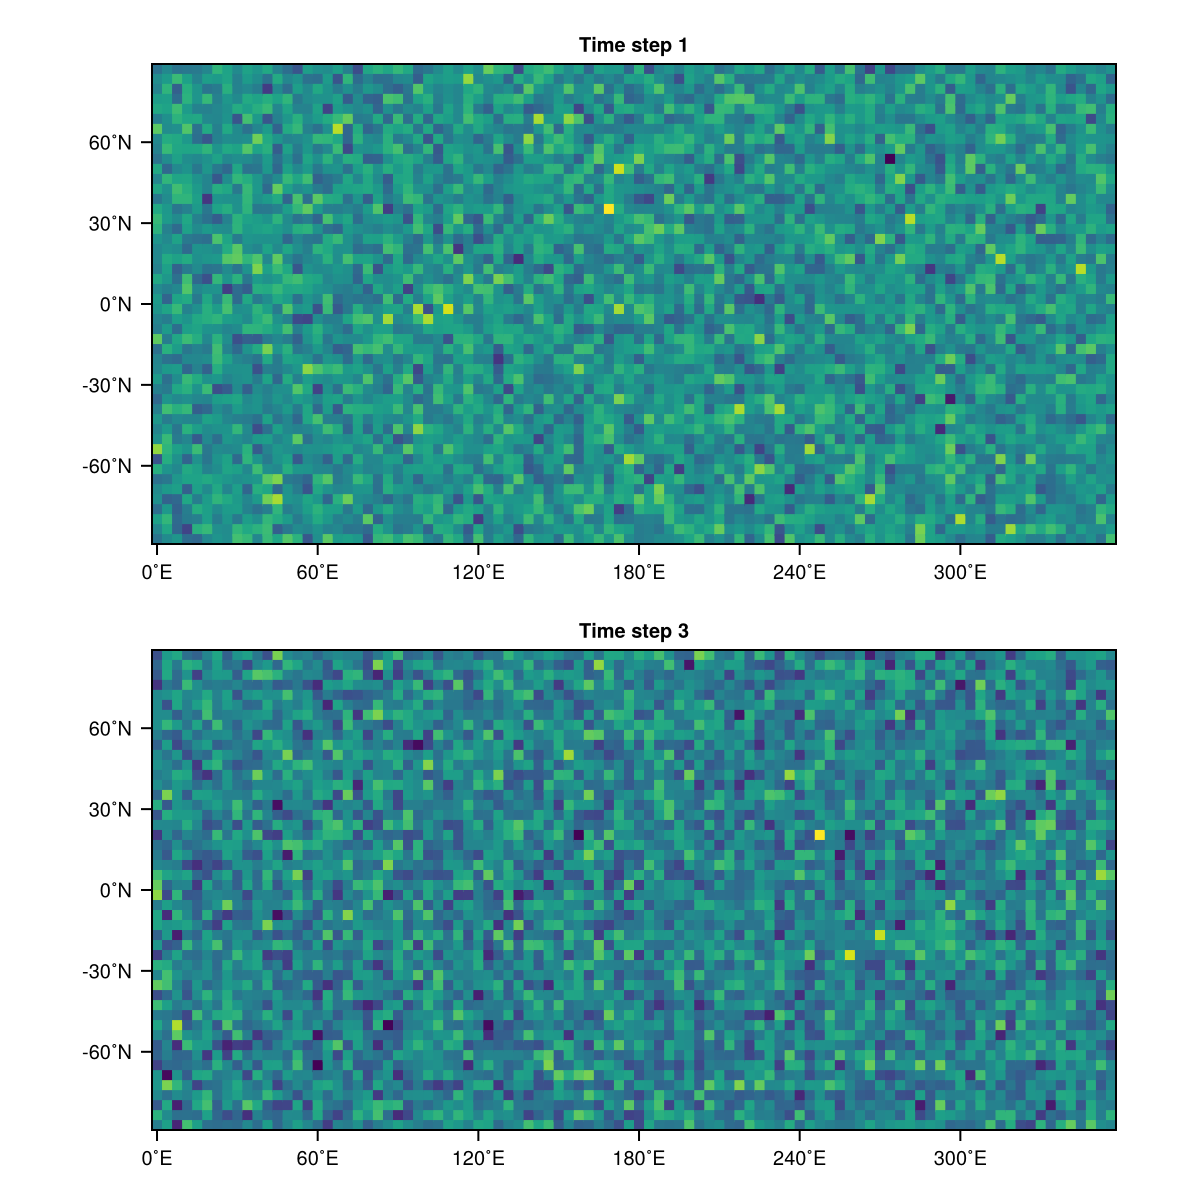
Note that the mutating heatmap! returns different types depending on the type of the first argument:
heatmap!(pos::GridPosition, field; ...)returns(ax, hm)whereaxis theAxisandhmis theHeatMapheatmap!(ax::Axis, field; ...)returns theHeatMapobject; all keyword arguments are passed on toMakie.heatmap!
Globe Plots
For interactive 3D visualizations, SpeedyWeather.jl provides globe plots through the GeoMakie extension. These work with both GLMakie (interactive) and CairoMakie (static).
We can visualize the grid itself by passing the grid type and number of rings to globe:
globe(FullGaussianGrid, 24; interactive = false)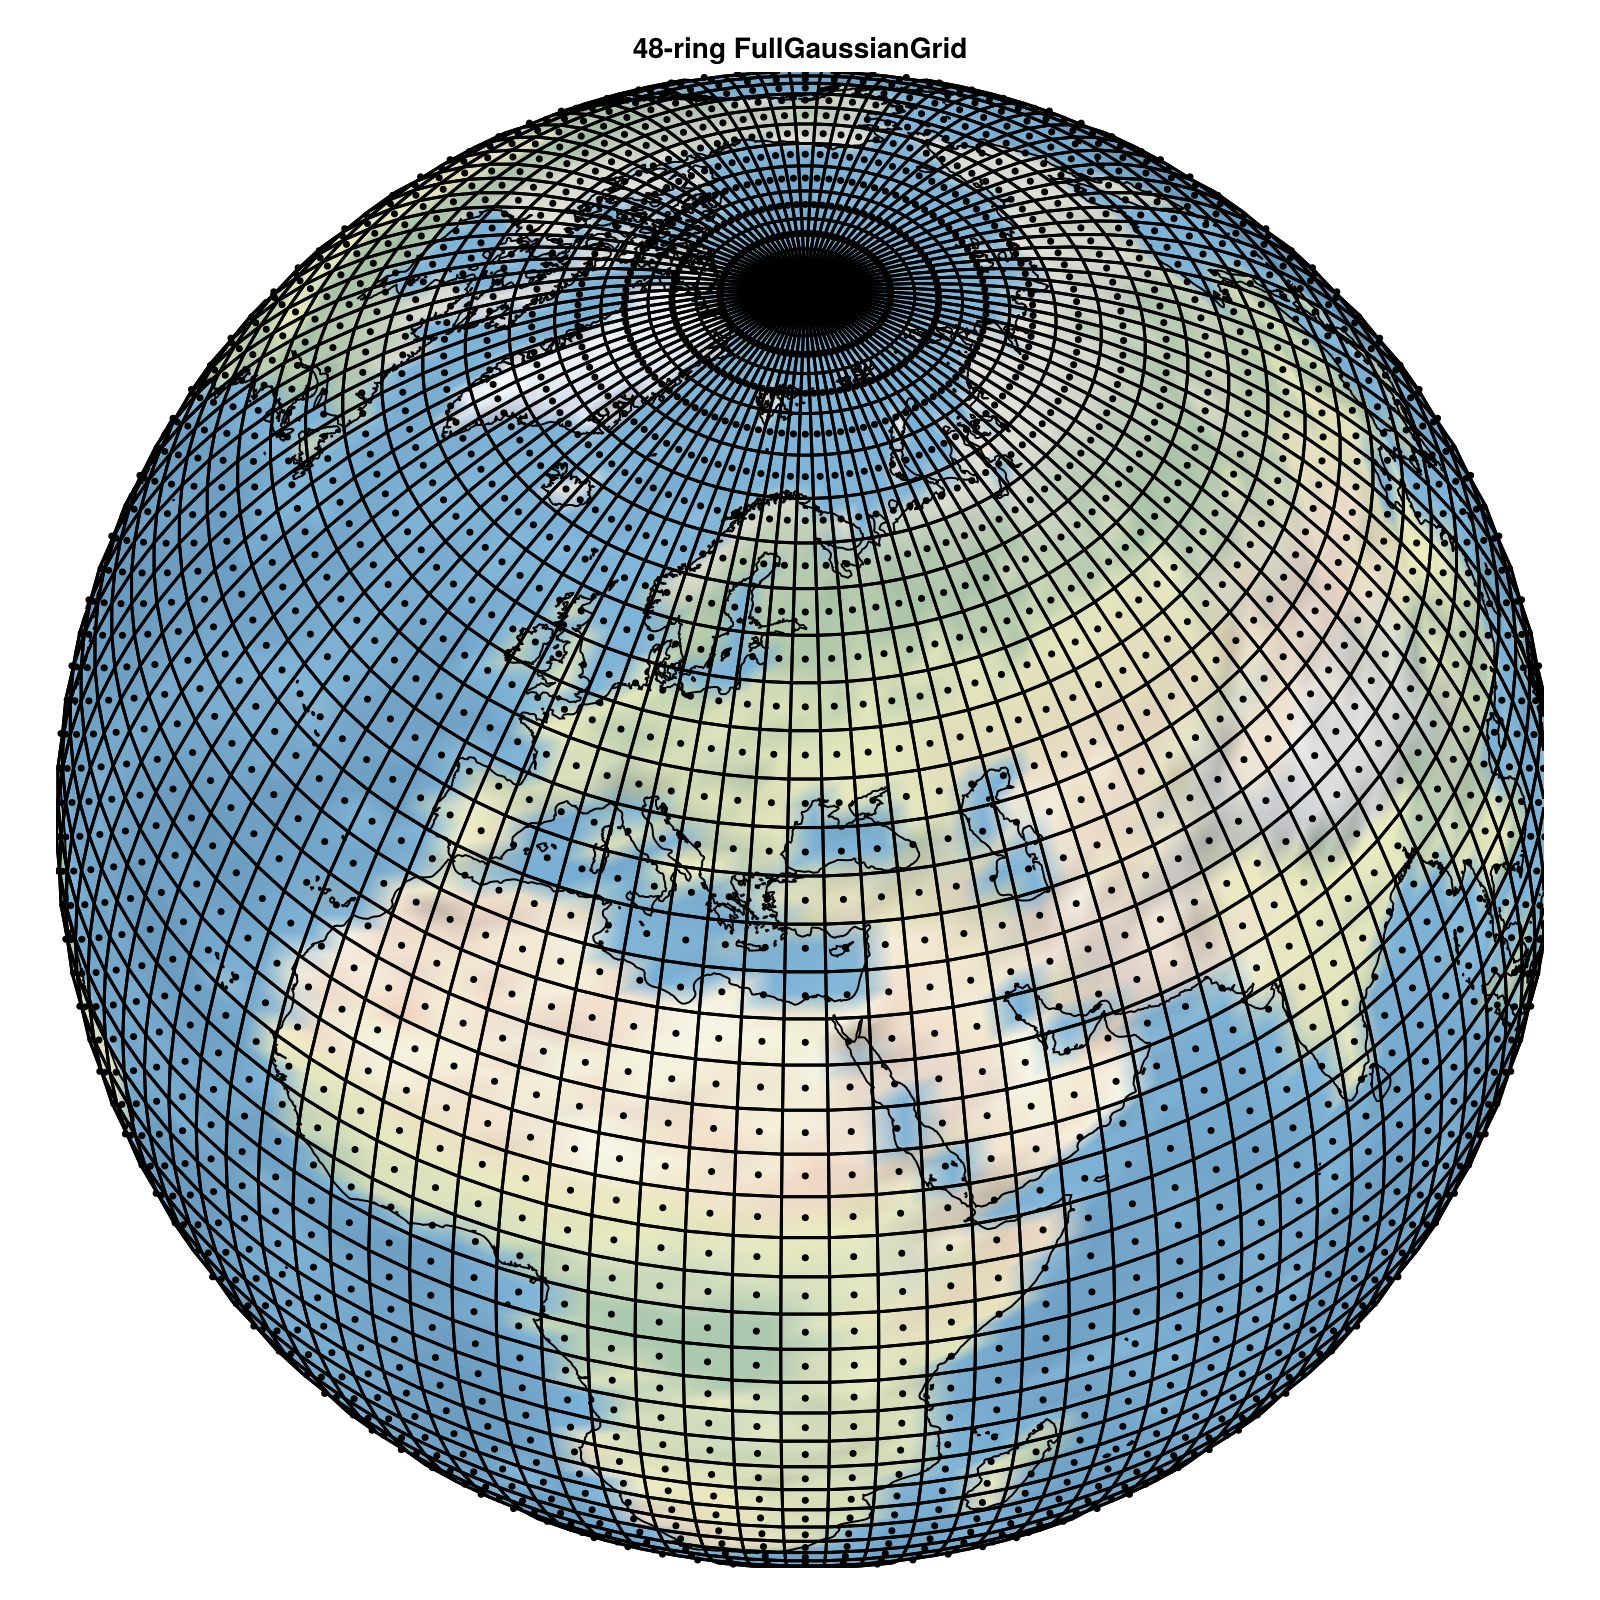
Or plot data on the globe:
grid = FullGaussianGrid(24)
field = randn(grid)
globe(field; interactive = false)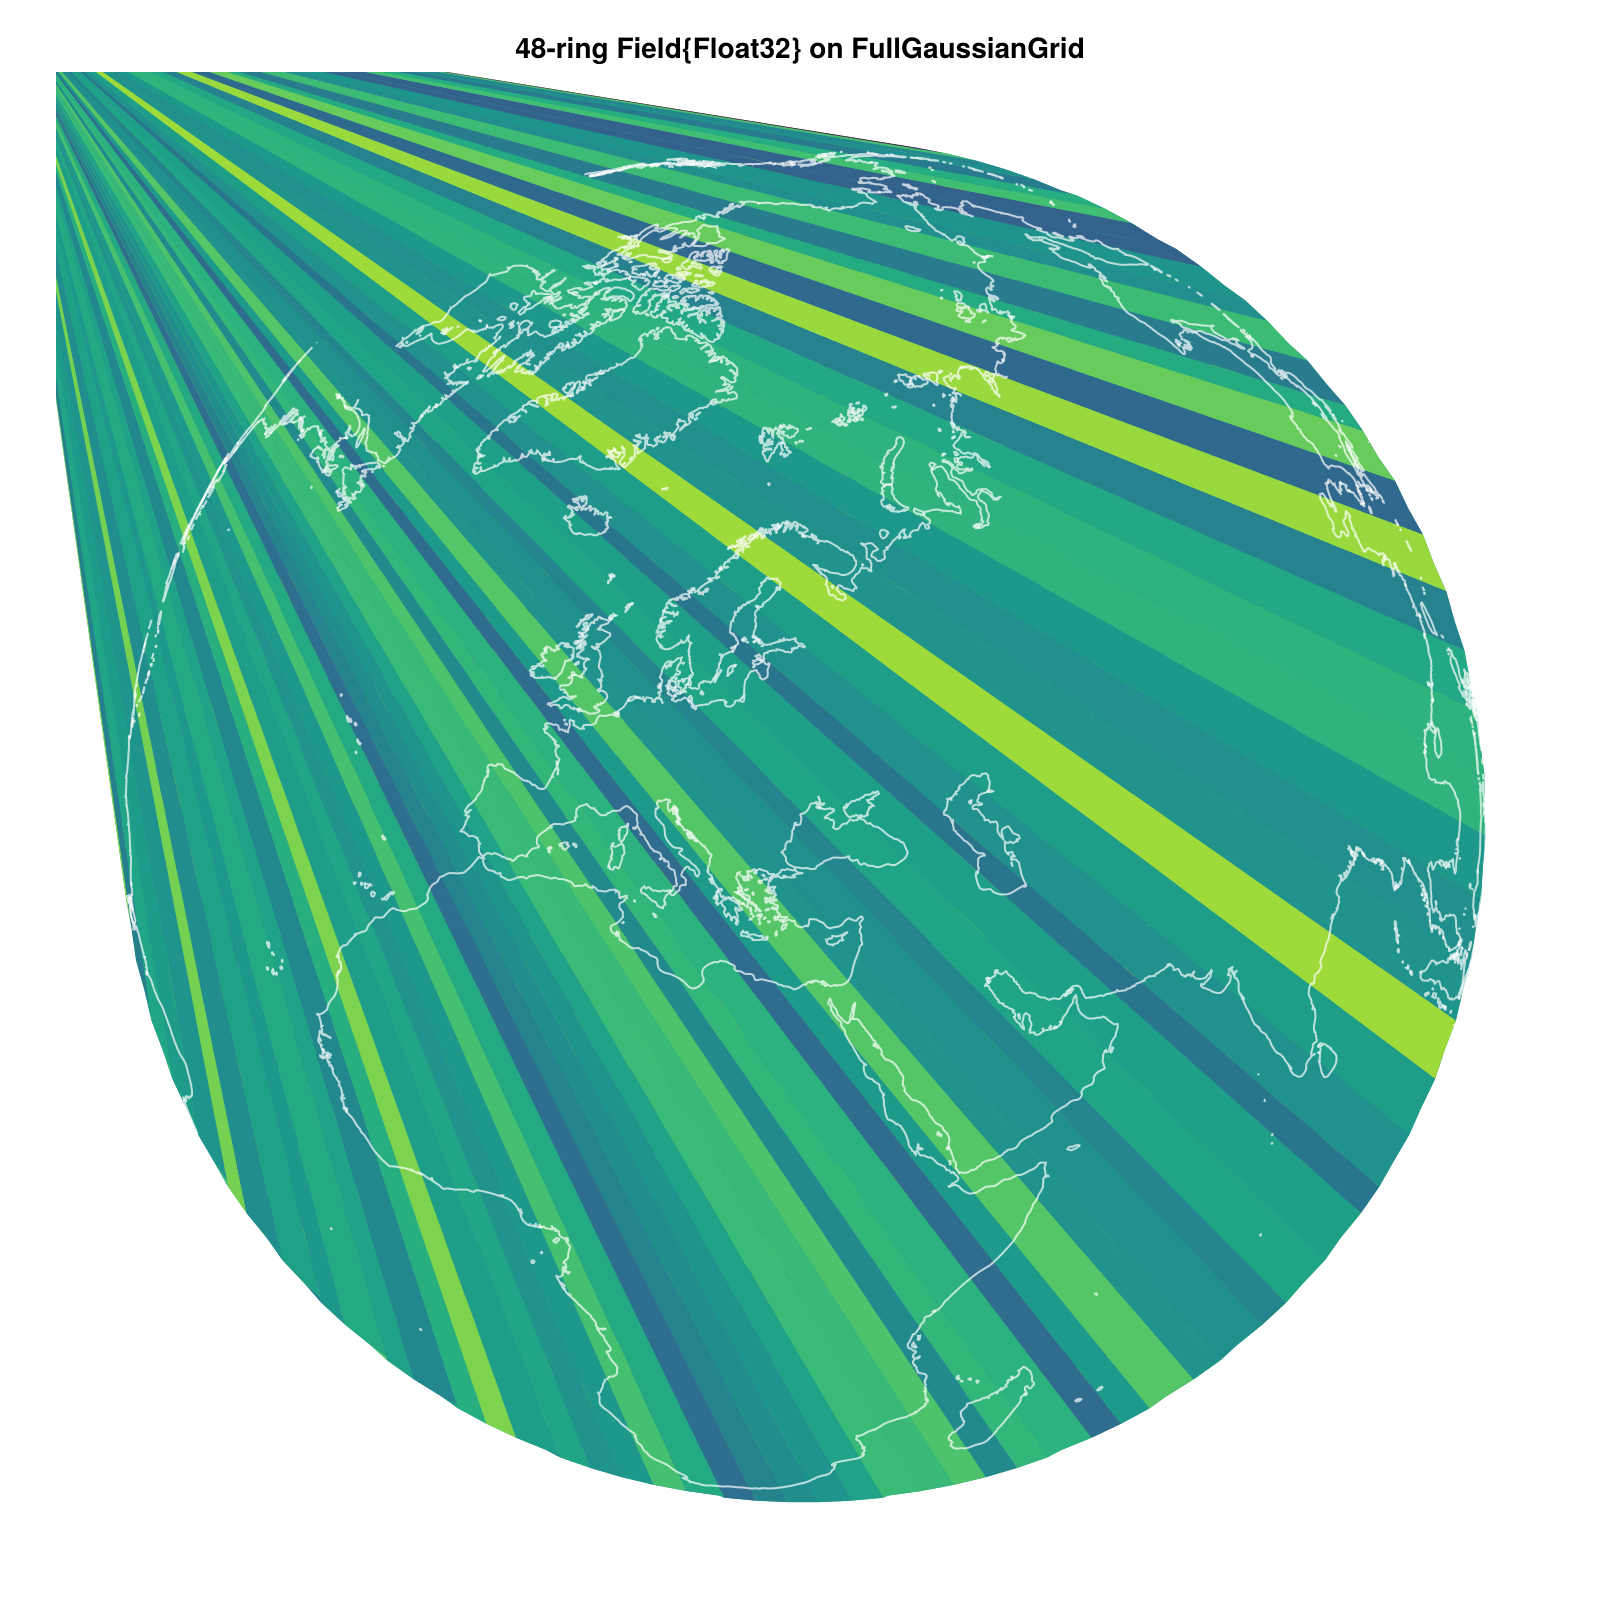
The globe function accepts several keyword arguments:
globe(
    OctahedralGaussianGrid, 24;
    interactive = false,
    title = "Octahedral Gaussian Grid",
    color = :blue,
    faces = true,
    centers = true,
    coastlines = true,
    background = true
)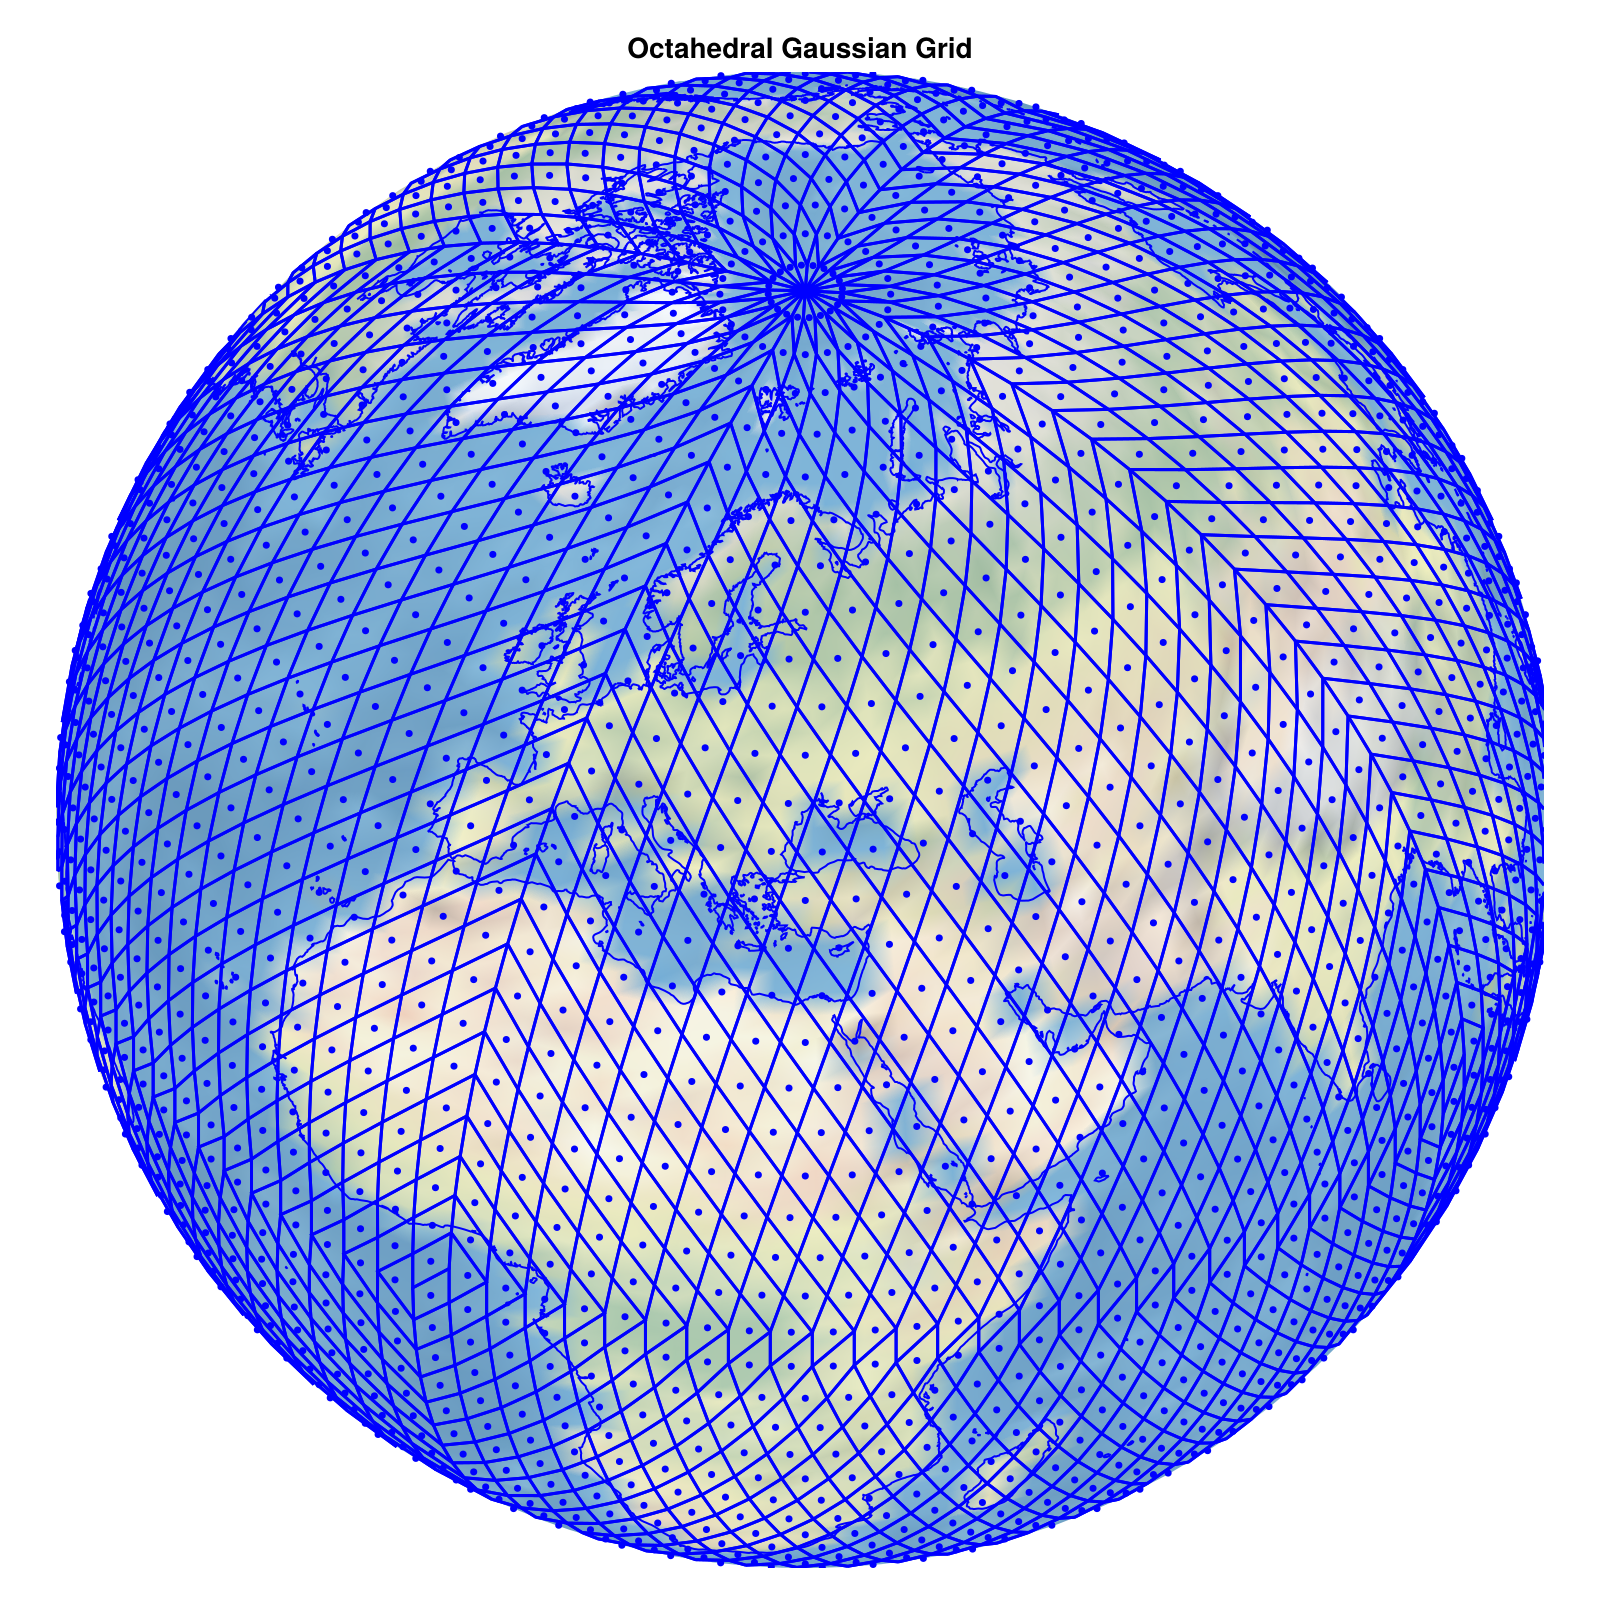
Available options:
interactive::Bool- Use 3D rotation/zoom (requiresGLMakie)title::String- Plot titlecolor- Color for grid points and linesfaces::Bool- Show grid cell boundariescenters::Bool- Show grid pointscoastlines::Bool- Add coastlinesbackground::Bool- Add Earth background image
Like heatmaps, globe plots have mutating variants that plot into an existing Figure or Axis:
fig = Figure(size = (800, 800))
ax, plotdata = globe!(fig[1, 1], FullGaussianGrid, 24; interactive = false)
fig
plotdata is a NamedTuple with keys :background, :centers, :faces, and :coastlines.
The mutating globe! also returns different values depending on the arguments:
globe!(pos::GridPosition, Grid, nlat_half; ...)returns(ax, plotdata)whereplotdatacontains the plotted elementsglobe!(pos::GridPosition, field; ...)returns(ax, poly)wherepolyis aPolyplotglobe!(ax::Axis, Grid, nlat_half; ...)returnsplotdataNamedTupleglobe!(ax::Axis, field; ...)returns thePolyplot object
Multi-panel Figures
The mutating functions like heatmap! are especially useful for composing multiple plots into a single Figure, since it returns both the Axis and HeatMap needed to share components across panels.
grid = OctahedralGaussianGrid(48)
u_field = randn(grid)
v_field = randn(grid)

fig = Figure(size = (1000, 300))
_, hm1 = heatmap!(fig[1, 1], u_field; title = "Zonal wind",     colormap = :balance, colorrange = (-3, 3))
_, hm2 = heatmap!(fig[1, 2], v_field; title = "Meridional wind", colormap = :balance, colorrange = (-3, 3))
Colorbar(fig[1, 3], hm1, ticklabelsize = 10)
resize_to_layout!(fig)
fig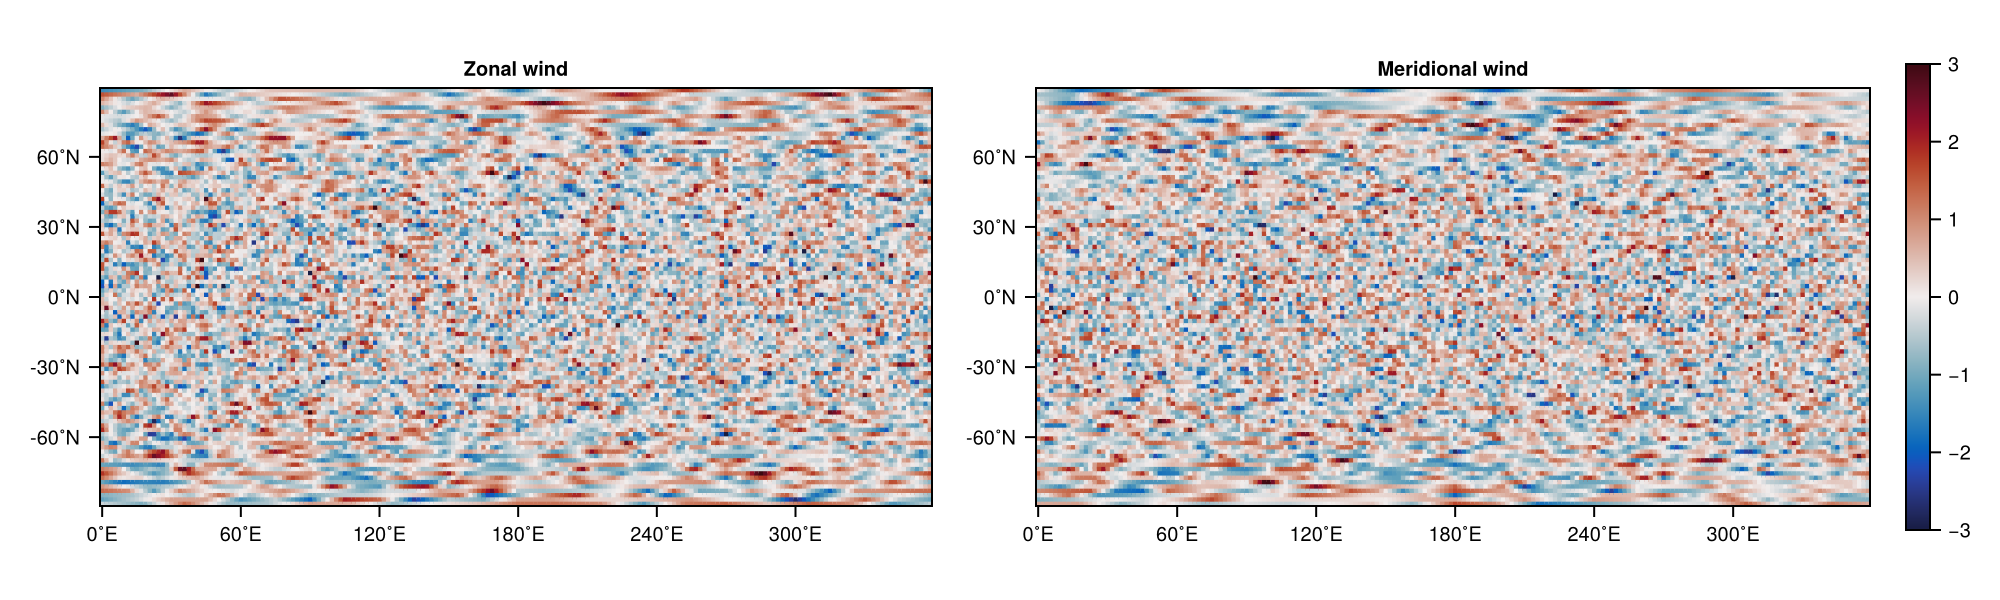
Tips
Use the Axis variants of heatmap! and globe! when updating plots repeatedly; they skip figure and axis allocation. When interpolation from a reduced grid happens many times (e.g. in an animation loop), pre-interpolate once with RingGrids.interpolate and plot the resulting full field directly.
For the Makie backend, GLMakie supports interactive zoom and rotation in 3D globe plots, CairoMakie produces static publication-quality figures, and UnicodePlots gives quick terminal previews.
API Reference
Makie.heatmap! Method
heatmap!(
    pos::GridPosition,
    field::AbstractField2D{T, ArrayType, Grid} where {T, ArrayType, Grid<:AbstractFullGrid};
    title::String,
    aspect,
    titlesize,
    xticklabelsize,
    yticklabelsize,
    axis_kwargs,
    kwargs...
) -> Tuple{Any, Any}
Mutating variant of heatmap for RingGrids Fields. Returns both the Axis as well as the plotting object returned by Makie.heatmap!.
Makie.heatmap! Method
heatmap!(
    ax::Makie.AbstractAxis,
    field::AbstractField2D{T, ArrayType, Grid} where {T, ArrayType, Grid<:AbstractFullGrid};
    kwargs...
)
Mutating variant of heatmap for RingGrids Fields that plots directly into an existing Axis. Returns the plotting object created by Makie.heatmap!.
Makie.heatmap Method
heatmap(
    field::AbstractField2D{T, ArrayType, Grid} where {T, ArrayType, Grid<:AbstractFullGrid};
    title::String=default_title(field),
    size=(600, 300),
    kwargs...
) -> Figure
Defines Makie's heatmap function for a field::AbstractFullField2D which can be reshaped into a matrix.
Makie.heatmap Method
heatmap(
    field::AbstractField2D;
    title::String=default_title(field),
    kwargs...
)
Defines Makie's heatmap function for afield::AbstractField2D via interpolation to ::AbstractFullField2D (which can be reshaped into a matrix.)
RingGrids.globe! Method
globe!(
    pos::GridPosition,
    field::AbstractField2D;
    interactive::Bool=true,
    title::String=default_title(field),
    colormap=:viridis,
    coastlines::Bool=true,
    axis_kwargs=(;)
) -> Tuple{Any, Any}
Mutating variant of globe for RingGrids Fields. Creates or updates a globe plot in the given GridPosition. Returns the Axis and the PolyPlot object.
RingGrids.globe! Method
globe!(
    pos::GridPosition,
    Grid::Type{<:AbstractGrid},
    nlat_half::Integer;
    interactive::Bool,
    title::String,
    color,
    faces::Bool,
    centers::Bool,
    coastlines::Bool,
    background::Bool,
    axis_kwargs
) -> Tuple{Any, NamedTuple}
Mutating variant of globe for RingGrids grid types. Creates or updates a globe plot in the given GridPosition. Returns the Axis and a NamedTuple of the plotted plotdata.
RingGrids.globe! Method
globe!(
    ax::Makie.AbstractAxis,
    field::AbstractField2D;
    interactive::Bool,
    colormap,
    coastlines::Bool
)
Mutating variant of globe that plots directly into an existing Axis. Returns the PolyPlot object.
RingGrids.globe! Method
globe!(
    ax::Makie.AbstractAxis,
    Grid::Type{<:AbstractGrid},
    nlat_half::Integer;
    interactive::Bool,
    color,
    faces::Bool,
    centers::Bool,
    coastlines::Bool,
    background::Bool
) -> NamedTuple
Mutating variant of globe that plots directly into an existing Axis. Returns a NamedTuple of the plotted plotdata.
RingGrids.globe Method
globe(
    field::AbstractField2D;
    interactive::Bool,
    title::String,
    colormap,
    coastlines::Bool
) -> Figure
Create a 3D interactive globe plot of the data in field displayed as polygons bounded by the cell faces. Optionally, add coastlines (default true).
RingGrids.globe Method
globe(
    Grid::Type{<:AbstractGrid},
    nlat_half::Integer;
    interactive::Bool=true,
    title::String=default_title(Grid, nlat_half),
    color=:black,
    faces::Bool=true,
    centers::Bool=true,
    coastlines::Bool=true,
    background::Bool=true
) -> Figure
Create a 3D interactive globe plot of the grid Grid at resolution nlat_half displaying cell centers and faces. Optionally, add coastlines and a background image of the Earth.
RingGridsGeoMakieExt._plot_globe_field! Method
_plot_globe_field!(ax, field; kwargs...)Internal helper to plot a field on a globe as polygons. Returns the PolyPlot object.
RingGridsGeoMakieExt._plot_globe_grid! Method
_plot_globe_grid!(ax, Grid, nlat_half; kwargs...)Internal helper to plot grid cells and points on a globe. Returns a NamedTuple of the plotted plotdata.
sourceReferences
Makie.jl - Flexible plotting library
GeoMakie.jl - Geographic plotting extension
RingGrids.jl - Ring-based grid definitions